According to ARRS’ American Journal of Roentgenology (AJR), evaluating chest CT findings offers an additional approach for demonstrating the efficacy of different COVID-19 vaccines in reducing the impact of a COVID-19 diagnosis.
Read more here.
">

According to ARRS’
American Journal of Roentgenology (
AJR), evaluating chest CT findings offers an additional approach for demonstrating the efficacy of different COVID-19 vaccines in reducing the impact of a COVID-19 diagnosis.
Read more here.
" loading="lazy" typeof="foaf:Image" class="img-responsive">
Radiological Society of North America
Read the full article.
">
 (A), FAN modelling (B), and hyperpolarized Xenon imaging (C, D) in both non-hospitalized post-Covid-19 condition and post-hospitalized COVID-19 participants. Results from both the low-resolution and ventilation imaging are similar and did not correlate with clinical or dissolved phase imaging results. Image courtesy of the <a href=")
Radiological Society of North America
Read the full article.
" loading="lazy" typeof="foaf:Image" class="img-responsive">
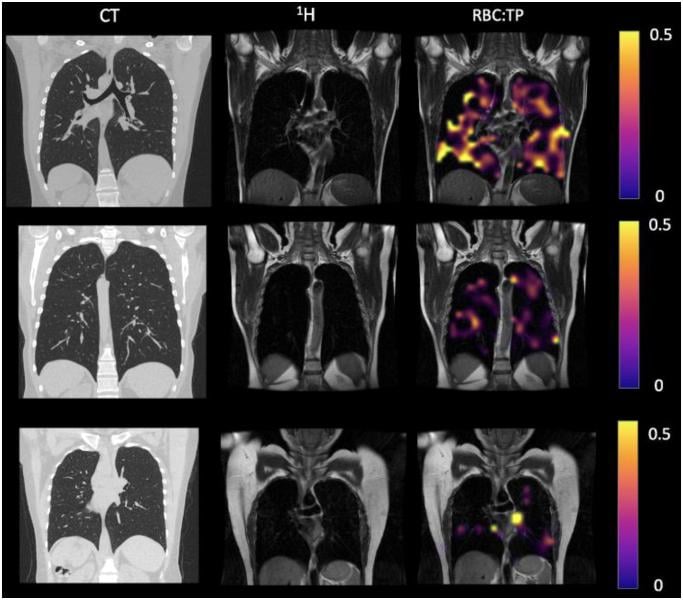
COVID patients. There is minimal damage on cT, and yet highly heterogeneous and low RBC:TP in the lungs of post-hospitalized COVID-19 patients. Image courtesy of Grist JT et al., published online in
Radiology on May 24, 2022.
Read the full article.
">
, and proton and RBC:TP imaging from post-hospitalized <a href=")
COVID patients. There is minimal damage on cT, and yet highly heterogeneous and low RBC:TP in the lungs of post-hospitalized COVID-19 patients. Image courtesy of Grist JT et al., published online in
Radiology on May 24, 2022.
Read the full article.
" loading="lazy" typeof="foaf:Image" class="img-responsive">
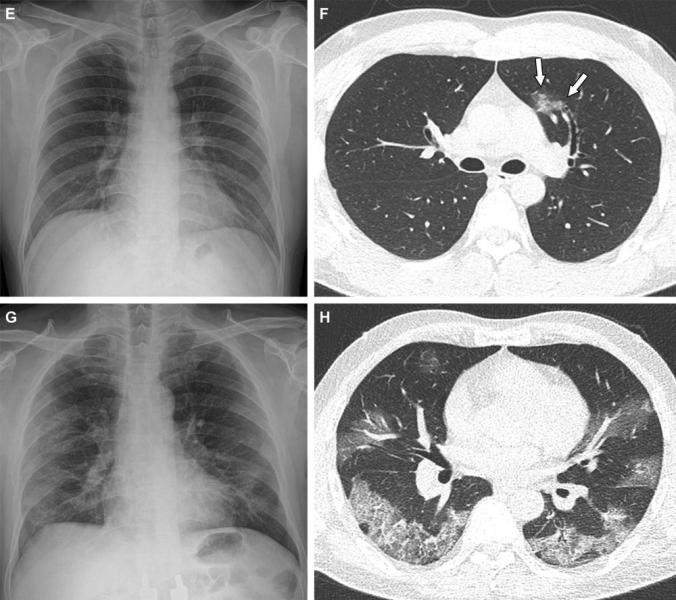
X-ray (CXRs) and CT images. (
E and
F) A 36-year-old male with no history of vaccination for
COVID- 19. The patient had no history of comorbidity. (
E) CXR obtained at admission showing no abnormal opacification in either lung zone. CXR extent of pneumonia was scored as 0 (no evidence of pneumonia). (
F) Axial chest CT image obtained on the same day showing unilateral ground-glass opacity with a nonrounded morphology and non-peripheral distribution in the left upper lobe (arrows). CT extent of pneumonia was scored as 1 (1-25% involvement) and this case was classified as indeterminate appearance of COVID-19 according to the RSNA chest CT classification system. (
G and
H) A 58-year-old male with no history of COVID-19 vaccination. The patient had a history of hypertension and diabetes. He required supplemental oxygen on admission and was admitted to intensive care unit one day later. (
G) CXR at admission showing patchy ground-glass opacities in both middle- to lower-lung zones. CXR extent of pneumonia was scored as 2 (>25% involvement). (
H) Axial chest CT image obtained on the same day showing multifocal ground-glass opacities with a crazy-paving appearance in bilateral lungs. CT extent of pneumonia was scored as 2 (>25% involvement) and was classified as typical appearance of COVID-19 according to the
RSNA chest CT classification system.
Read the full study
">

X-ray (CXRs) and CT images. (
E and
F) A 36-year-old male with no history of vaccination for
COVID- 19. The patient had no history of comorbidity. (
E) CXR obtained at admission showing no abnormal opacification in either lung zone. CXR extent of pneumonia was scored as 0 (no evidence of pneumonia). (
F) Axial chest CT image obtained on the same day showing unilateral ground-glass opacity with a nonrounded morphology and non-peripheral distribution in the left upper lobe (arrows). CT extent of pneumonia was scored as 1 (1-25% involvement) and this case was classified as indeterminate appearance of COVID-19 according to the RSNA chest CT classification system. (
G and
H) A 58-year-old male with no history of COVID-19 vaccination. The patient had a history of hypertension and diabetes. He required supplemental oxygen on admission and was admitted to intensive care unit one day later. (
G) CXR at admission showing patchy ground-glass opacities in both middle- to lower-lung zones. CXR extent of pneumonia was scored as 2 (>25% involvement). (
H) Axial chest CT image obtained on the same day showing multifocal ground-glass opacities with a crazy-paving appearance in bilateral lungs. CT extent of pneumonia was scored as 2 (>25% involvement) and was classified as typical appearance of COVID-19 according to the
RSNA chest CT classification system.
Read the full study
" loading="lazy" typeof="foaf:Image" class="img-responsive">
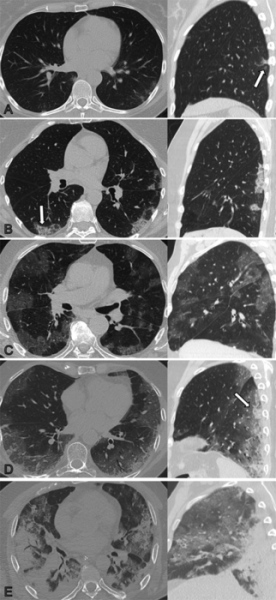
Non-contrast axial and sagittal chest CTs corresponding to the CT severity score. (A) 1: minimal (subtle GGO, very few findings): CT shows subtle subpleural GGO (arrow) in the right and left lower lobe. (B) 2: low (several GGO, subtle reticulation): CT shows several subpleural GGO and superimposed reticulation (arrow) in the right and left lower lobe and left upper lobe. (C) 3: moderate (multiple GGO, reticulation, small consolidation): CT shows multiple GGO in all lobes. (D) 4: marked (extensive GGO, consolidation, reticulation with distortion): CT shows extensive subpleural GGO, and consolidations (arrow) in the dependent lung. (E) 5: massive (massive findings, parenchymal destructions*): CT shows massive consolidations in the dependent lung areas as well as extensive GGO in the upper lobes. *Parenchymal destruction includes pneumatocele, cavitation or abscess formation. GGO= ground-glass opacities. Image courtesy of the
Radiological Society of North America
">

Non-contrast axial and sagittal chest CTs corresponding to the CT severity score. (A) 1: minimal (subtle GGO, very few findings): CT shows subtle subpleural GGO (arrow) in the right and left lower lobe. (B) 2: low (several GGO, subtle reticulation): CT shows several subpleural GGO and superimposed reticulation (arrow) in the right and left lower lobe and left upper lobe. (C) 3: moderate (multiple GGO, reticulation, small consolidation): CT shows multiple GGO in all lobes. (D) 4: marked (extensive GGO, consolidation, reticulation with distortion): CT shows extensive subpleural GGO, and consolidations (arrow) in the dependent lung. (E) 5: massive (massive findings, parenchymal destructions*): CT shows massive consolidations in the dependent lung areas as well as extensive GGO in the upper lobes. *Parenchymal destruction includes pneumatocele, cavitation or abscess formation. GGO= ground-glass opacities. Image courtesy of the
Radiological Society of North America
" loading="lazy" typeof="foaf:Image" class="img-responsive">
More information
">
 and statistical parametric mapping analysis of metabolic group differences (second to fifth rows) in patients with COVID-19–related encephalopathy, patients with post-COVID-19 syndrome, and patients with post-COVID-19 syndrome and hyposmia compared to healthy controls (n=13). Image Created by PT Meyer, S Hellwig, G Blazhenets and JA Hosp, Medical Center – University of Freiburg, Germany. <a href=")
More information
" loading="lazy" typeof="foaf:Image" class="img-responsive">


 issued a statement on Jan. 14 regarding the possible effect of Omicron infection on FDG PET/CT scans.</p>")

. This enables 3D mapping across a range of scales, allowing clinicians to view the whole organ as never before by imaging it as a whole and then zooming down to cellular level. The technique uses X-rays supplied by the European Synchrotron in Grenoble, France.</p>")
 compared with precontrast SSFP sequence (not shown) is observed on early post-contrast short-axis SSFP images in (A) 16-year-old male, (B) 17-year-old male, (C) 16-year-old male, and (D) 19-year-old male, and on early postcontrast short-axis perfusion image in (E) 17-year-old male (arrow, A-E). Late gadolinium enhancement (LGE) is also present (arrows) in all 5 patients (F, G, </p>") Read more about this new scanner.
Read more about this new scanner.
">
阅读更多" title="
Lung images of a post-COVID patient with a Siemens Naeotom Alpha photon-counting CT system. The photon-counting technology allows simultaneous acquisition and visualization of detailed structures (center image) combined with functional information (right image). For comparison is an image with conventional CT (left). Courtesy of Dr. J. Ferda, University Hospital Plzen, Czech Republic. Read more about this new scanner.
" loading="lazy" typeof="foaf:Image" class="img-responsive">
Read more. Image courtesy of RSNA.
">
, and the gas uptake phase where there are numerous areas where there is gas present but it cannot be transferred to the blood due to micro-emboli (seen in the right RBC images). <a href=")
Read more. Image courtesy of RSNA.
" loading="lazy" typeof="foaf:Image" class="img-responsive">
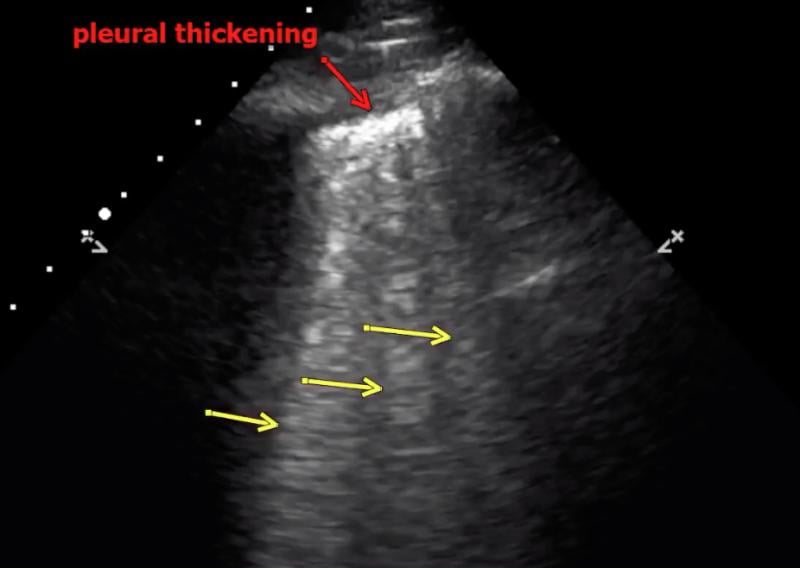
 VIDEO: COVID Pneumonia Lung Consolidation on Ultrasound.
.
">
视频中查看此动态图像:超声上的COVID肺炎肺实变。" title="
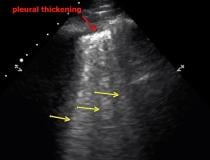
An example of COVID-19 (SARS-CoV-2) pneumonia lung consolidation on ultrasound and related B-lines in the image. See this image in motion in the VIDEO: COVID Pneumonia Lung Consolidation on Ultrasound..
" loading="lazy" typeof="foaf:Image" class="img-responsive">
Read the study.
">
. Researchers at Johns Hopkins Medicine showed in a May 2021 Journal of the American Society of Echocardiography study that speckle-tracking strain echocardiograms may predict which patients with COVID-19 are most at risk of developing atrial fibrillation (AF). <a href=")
Read the study.
" loading="lazy" typeof="foaf:Image" class="img-responsive">
. Coronavirus often caused thrombus formation in the body, leading to numerous types of complications, including pulmonary embolism, stroke, heart attack, deep vein thrombosis (DVT) and ischemia or infarcts in various organs. Watch this image in motion in the VIDEO: Example of COVID Thrombosis on Ultrasound Imaging. Image courtesy of Margarita Revzin et al. </p>") Read more in the original study
Read more in the original study. Image courtesy of RSNA.
">
 at the COVID vaccine injection site on 18-FDG PET/CT. <a href=")
Read more in the original study. Image courtesy of RSNA.
" loading="lazy" typeof="foaf:Image" class="img-responsive">
Deconstructing the Infectious Machinery of SARS-CoV-2.
">
 that have burst out of kidney cells (green), which the virus hijacked for replication. The the bulging, spherical cells in the upper right and bottom left corners are distorted and about to burst from the viral particles inside, and are beginning to self-destruct. Image from NIAID Integrated Research Facility. Read more in the article <a href=")
Deconstructing the Infectious Machinery of SARS-CoV-2.
" loading="lazy" typeof="foaf:Image" class="img-responsive">
Read more. Image courtesy of the American Roentgen Ray Society (ARRS), American Journal of Roentgenology (AJR)
">
 in right upper lobe. B, Electron density spectral CT image obtained at same time as image in A shows lesions (within red box) in right upper lobe. C, Follow-up conventional axial chest CT image obtained 5 days after images in A and B confirm presence of lesions (within red box) in right upper lobe. <a href=")
Read more. Image courtesy of the American Roentgen Ray Society (ARRS), American Journal of Roentgenology (AJR)
" loading="lazy" typeof="foaf:Image" class="img-responsive">
 Read more in the original study
. Image courtesy of RSNA.
">

Read more in the original study. Image courtesy of RSNA.
" loading="lazy" typeof="foaf:Image" class="img-responsive">
 in 16-year-old male (A) and 17-year-old male (B). Quantitative criteria included T2 parametric mapping and quantification of myocardial signal intensity ratios. Focal subepicardial edema of the basilar left ventricular inferior wall (arrow) is shown on source image from T2</p>") Read more in the original study
Read more in the original study. Image courtesy of RSNA.
">

Read more in the original study. Image courtesy of RSNA.
" loading="lazy" typeof="foaf:Image" class="img-responsive">
Read more from this February 2021 study.
">

Read more from this February 2021 study.
" loading="lazy" typeof="foaf:Image" class="img-responsive">
Read more in the original study. Image courtesy of RSNA.
">
 after second COVID-19 mRNA vaccination dose. The uptake in the lymph node is typical of vaccinated patients, with the adenopathy occuring on the side with the arm that was vaccinated. <a href=")
Read more in the original study. Image courtesy of RSNA.
" loading="lazy" typeof="foaf:Image" class="img-responsive">
Read more from this February 2021 study.
">
. BI-RADS category 0 was assigned. Ultrasound from diagnostic work-up performed 7 days later showed no change in lymph node size. BI-RADS 3 was assigned. <a href=")
Read more from this February 2021 study.
" loading="lazy" typeof="foaf:Image" class="img-responsive">
Rezvin et al. Radiogrophics
">
 and peribronchovascular (arrow) thickening, and diffuse ground-glass opacities. Pulmonary edema superimposed on the typical COVID-19 pneumonia. <a href=")
Rezvin et al. Radiogrophics
" loading="lazy" typeof="foaf:Image" class="img-responsive">
Read more. Image courtesy of European Heart Journal
">

Read more. Image courtesy of European Heart Journal
" loading="lazy" typeof="foaf:Image" class="img-responsive">
Read more. Image by Lina Greenberg.
">
 infected with COVID-19 (SARS-CoV-2) (green). <a href=")
Read more. Image by Lina Greenberg.
" loading="lazy" typeof="foaf:Image" class="img-responsive">
Margarita Rezvin et al. Read more on the trials examining the use of anticoagulation to treat COVID clotting.
">

Margarita Rezvin et al.
Read more on the trials examining the use of anticoagulation to treat COVID clotting.
" loading="lazy" typeof="foaf:Image" class="img-responsive">
Read more on the trials. Image courtesy of
Margarita Revzin et al.
">
 is a major cause of complications. <a href=")
Read more on the trials. Image courtesy of
Margarita Revzin et al.
" loading="lazy" typeof="foaf:Image" class="img-responsive">
Margarita Revzin et al.
">

Margarita Revzin et al.
" loading="lazy" typeof="foaf:Image" class="img-responsive">
Find more information and figures on this patient case.
">
. <a href=")
Find more information and figures on this patient case.
" loading="lazy" typeof="foaf:Image" class="img-responsive">
Read more. Image from Circulation.
">

Read more. Image from Circulation.
" loading="lazy" typeof="foaf:Image" class="img-responsive">
 chest X-ray of a COVID-19 patient from Texas, showing COVID pneumonia along the sides of the chest walls. Photo from radiologist John Kim, M.D.</p>")
 Margarita Revzin et al.
">
 Coronal left upper extremity CT angiographic image shows an abrupt segmental occlusion (arrow) of the distal left brachial artery, indicative of peripheral arterial thromboembolization. Coronal three-dimensional maximum intensity projection shows abrupt cutoff (arrow) of the left brachial artery. Image courtesy of <a href=")
Margarita Revzin et al.
" loading="lazy" typeof="foaf:Image" class="img-responsive">
Margarita Revzin et al.
">

Margarita Revzin et al.
" loading="lazy" typeof="foaf:Image" class="img-responsive">
Margarita Revzin et al.
">
. COVID causes clot formation throughout the body in some patients, leading to organ infarcts like this, stroke and PE. Image courtesy of <a href=")
Margarita Revzin et al.
" loading="lazy" typeof="foaf:Image" class="img-responsive">
Margarita Revzin et al.
">
. Air is depicted anterior to the pulmonary artery (white arrow) and adjacent to the main pulmonary artery and left atrial appendage, indicative of pneumomediastinum. Image courtesy of <a href=")
Margarita Revzin et al.
" loading="lazy" typeof="foaf:Image" class="img-responsive">
Margarita Revzin et al.
">
 occlusion in a 56-year-old woman with neurologic deficits who had been hospitalized with COVID-19. Coronal three-dimensional maximum intensity projection reformatted image of the head and neck show an abrupt cutoff at the origin of the CCA (black arrow). The left carotid vasculature is well opacified with intravenous contrast material (white arrow). Image courtesy of <a href=")
Margarita Revzin et al.
" loading="lazy" typeof="foaf:Image" class="img-responsive">
Margarita Revzin et al.
">
 and peripheral deep vein thrombosis (DVT) in a 78-year-old man with COVID-19 with leg swelling and abdominal pain. Axial contrast-enhanced CT images show filling defects in the bilateral common femoral veins (white arrows). Image courtesy of <a href=")
Margarita Revzin et al.
" loading="lazy" typeof="foaf:Image" class="img-responsive">
Margarita Revzin et al.
">
 vertical echogenic bands (white arrows) extending from the pleural surface to the deeper portions of the lung, consistent with B-line artifacts, indicating subpleural interstitial edema. Note that the lung pleura is thickened and irregular (black arrow). Image courtesy of <a href=")
Margarita Revzin et al.
" loading="lazy" typeof="foaf:Image" class="img-responsive">
Margarita Revzin et al.
">
 shown by the arrows. Image courtesy of <a href=")
Margarita Revzin et al.
" loading="lazy" typeof="foaf:Image" class="img-responsive">
Margarita Revzin et al.
">
 distending the right popliteal artery. The characteristic knocking or “stump-thump” waveform with absence of diastolic flow and low amplitude imply the presence of occlusion just distal to the area of interrogation. Image courtesy of <a href=")
Margarita Revzin et al.
" loading="lazy" typeof="foaf:Image" class="img-responsive">
Margarita Revzin et al.
">
 associated with a peripherally inserted central catheter (PICC) line in a 54-year-old man with COVID-19. Sagittal color Doppler ultrasound image shows an echogenic thrombus (black arrows) in the right subclavian vein, associated with the PICC line (white arrow). Image courtesy of <a href=")
Margarita Revzin et al.
" loading="lazy" typeof="foaf:Image" class="img-responsive">
 heavily infected with SARS-CoV-2 virus particles (orange), isolated from a patient sample. Image captured at the National Institute of Allergy and Infectious Diseases (NIAID) Integrated Research Facility (IRF) in Fort Detrick, Maryland. Photo courtesy of NIAID</p>") Radiology article
Radiology article. Brain MRI in two critically ill COVID-19 patients with persistently depressed mental status including a 56-year old man (A-C), and a 64-year old man (D-F). Axial diffusion-weighted (A, D), apparent diffusion coefficient (B, E) and FLAIR (C, F) images at the level of centrum semiovale in both patients demonstrate symmetric diffuse T2/FLAIR hyperintensity (arrowheads) and mild restricted diffusion (thick arrows) involving the deep and subcortical white matter with relative sparing of juxtacortical white matter (thin arrows) in both patients. The restricted diffusion is more conspicuous than the T2/FLAIR hyperintensity.
">

Radiology article. Brain MRI in two critically ill COVID-19 patients with persistently depressed mental status including a 56-year old man (A-C), and a 64-year old man (D-F). Axial diffusion-weighted (A, D), apparent diffusion coefficient (B, E) and FLAIR (C, F) images at the level of centrum semiovale in both patients demonstrate symmetric diffuse T2/FLAIR hyperintensity (arrowheads) and mild restricted diffusion (thick arrows) involving the deep and subcortical white matter with relative sparing of juxtacortical white matter (thin arrows) in both patients. The restricted diffusion is more conspicuous than the T2/FLAIR hyperintensity.
" loading="lazy" typeof="foaf:Image" class="img-responsive">
Radiology article: Axial T2-weighted (a) and FLAIR (b) Magnetic resonance imaging show diffuse hyperintense signal and edema of the caudate nucleus head, putamen, anterior limb of the internal capsule, and parts of external capsule and insula on the left side, with corresponding low values on the axial apparent diffusion coefficient map, in keeping with an acute infarct. Time-of-flight magnetic resonance angiography maximal intensity projection reformatted image demonstrates focal irregular narrowing and banding of the proximal left M1 segment of the middle cerebral artery with a slightly reduced distal flow in the middle cerebral artery.
">

Radiology article: Axial T2-weighted (a) and FLAIR (b) Magnetic resonance imaging show diffuse hyperintense signal and edema of the caudate nucleus head, putamen, anterior limb of the internal capsule, and parts of external capsule and insula on the left side, with corresponding low values on the axial apparent diffusion coefficient map, in keeping with an acute infarct. Time-of-flight magnetic resonance angiography maximal intensity projection reformatted image demonstrates focal irregular narrowing and banding of the proximal left M1 segment of the middle cerebral artery with a slightly reduced distal flow in the middle cerebral artery.
" loading="lazy" typeof="foaf:Image" class="img-responsive">
, and a 64-year old man (D-F). Axial diffusion-weighted (A, D), apparent diffusion coefficient (B, E), and FLAIR (C, F) images at the level of centrum semiovale in both patients demonstrate symmetric diffuse T2/FLAIR hyperintensity (arrowheads) and mild restricted diffusion (thick arrows) involving the deep and subcortical white matter with relative sparing of juxtacortical white matter (thin arrows) in both patients. The restricted diffusion is more conspicuous than the T2/FLAIR hyperintensity. Courtesy of the RSNA journal Radiology.</p>")
 image of two coronaviruses (COVID-19) from high-powered microscopy.</p>")
 image of two coronaviruses (COVID-19) from high-powered microscopy.</p>")
 image of coronavirus (COVID-19) attached to a host cell.</p>") Cardiac MRI Aids Evaluation of Children With Multisystem Inflammatory Syndrome (MIS-C) Associated With COVID-19
Cardiac MRI Aids Evaluation of Children With Multisystem Inflammatory Syndrome (MIS-C) Associated With COVID-19
">
. This severe autoimmune response that occurs a couple weeks after exposure to the SARS-CoV-2 virus. While COVID is largely asymptomatic in pediatric patients, MIS-C is a rare and severe reaction to the virus, which has occurred in more than 1,000 U.S. children as of late October 2020, including several fatalities. Read the article <a href=")
Cardiac MRI Aids Evaluation of Children With Multisystem Inflammatory Syndrome (MIS-C) Associated With COVID-19
" loading="lazy" typeof="foaf:Image" class="img-responsive">
Read more about this COVID complication and find more information on these images.
">

Read more about this COVID complication and find more information on these images.
" loading="lazy" typeof="foaf:Image" class="img-responsive">
Read more. Image courtesy of Umberto Sabatini
">

Read more. Image courtesy of Umberto Sabatini
" loading="lazy" typeof="foaf:Image" class="img-responsive">
Read more about this case. Image courtesy of Northwestern University
">
 of the left brachial plexus in the neck. The patient experienced left arm weakness and pain after recovering from COVID-19 respiratory illness, which prompted them to see their primary care physician. As a result of the MRI findings, the patient was referred to the COVID-19 neurology clinic for treatment. <a href=")
Read more about this case. Image courtesy of Northwestern University
" loading="lazy" typeof="foaf:Image" class="img-responsive">
Scroll through this dataset. Image courtesy of
Margarita Revzin et al.
">
 complicated by bowel ischemia and perforation in a 54-year-old man who presented to the emergency department with abdominal pain and was diagnosed with COVID-19. Contrast-enhanced CT images of the abdomen and pelvis show mucosal hyperenhancement involving the small bowel. <a href=")
Scroll through this dataset. Image courtesy of
Margarita Revzin et al.
" loading="lazy" typeof="foaf:Image" class="img-responsive">
Scroll through this dataset. Image courtesy of
Margarita Revzin et al.
">

Scroll through this dataset. Image courtesy of
Margarita Revzin et al.
" loading="lazy" typeof="foaf:Image" class="img-responsive">
Scroll through this dataset. Image courtesy of
Margarita Revzin et al.
">
. <a href=")
Scroll through this dataset. Image courtesy of
Margarita Revzin et al.
" loading="lazy" typeof="foaf:Image" class="img-responsive">
Read more. Image courtesy of the American Roentgen Ray Society (ARRS), American Journal of Roentgenology (AJR)
">
 in right upper lobe. B, Electron density spectral CT image obtained at same time as image in A shows lesions (within red box) in right upper lobe. C, Follow-up conventional axial chest CT image obtained 5 days after images in A and B confirm presence of lesions (within red box) in right upper lobe. <a href=")
Read more. Image courtesy of the American Roentgen Ray Society (ARRS), American Journal of Roentgenology (AJR)
" loading="lazy" typeof="foaf:Image" class="img-responsive">
See the entire CT dataset scroll through video. Image courtesy of
Margarita Revzin et al.
">
 showing COVID-19 pneumonia in the lungs with ground glass opacifies (GGOs) seen in typical COVID locations, clinging along the lower sections of the lung walls. <a href=")
See the entire CT dataset scroll through video. Image courtesy of
Margarita Revzin et al.
" loading="lazy" typeof="foaf:Image" class="img-responsive">
Thirona and
Delft Imaging. It will generate a score between 0 and 100 indicating the extent of COVID-19 related abnormalities, display such lung abnormalities through a heatmap and quantify the percentage of the lung that is affected. The COVID areas of the lung appear as wispy white sections in the lower lungs on the X-ray to the right.
Read more.
">
 algorithms to automatically detect and score the severity of COVID-19 pneumonia in the lungs from CT or DR imaging. This chest X-ray shows the CAD4COVID AI software developed by <a href=")
Thirona and
Delft Imaging. It will generate a score between 0 and 100 indicating the extent of COVID-19 related abnormalities, display such lung abnormalities through a heatmap and quantify the percentage of the lung that is affected. The COVID areas of the lung appear as wispy white sections in the lower lungs on the X-ray to the right.
Read more.
" loading="lazy" typeof="foaf:Image" class="img-responsive">
 used a new revolutionary imaging technology called Hierarchical Phase-Contrast Tomography (HiP-CT), to scan donated human organs, including lungs from a Covid-19 donor.</p>") https://www.ajronline.org/doi/full/10.2214/AJR.20.23617
https://www.ajronline.org/doi/full/10.2214/AJR.20.23617
">
. Bilateral common iliac artery and left internal iliac artery thrombi (not shown) were also seen, as well as signs of chronic atherosclerotic disease. After findings of concurrently performed chest CT raised concerns, patient was determined to have COVID-19. Read more in the <em>AJR</em> article: <strong><a href=")
https://www.ajronline.org/doi/full/10.2214/AJR.20.23617
" loading="lazy" typeof="foaf:Image" class="img-responsive">
https://www.ajronline.org/doi/full/10.2214/AJR.20.23617
">
 and nonocclusive aortic, celiac artery, and superior mesenteric artery thrombus (circle). Complete common hepatic artery thrombus (not shown) was also seen. Splenic and renal infarctions (not shown) were present, despite patent visualized associated arteries and veins. Concurrently performed IV contrast-enhanced chest CT angiogram (not shown) showed lobar and segmental pulmonary emboli; probable left lower lobe pulmonary infarction rather than pneumonia; and bilateral, multilobar, patchy but confluent ground-glass opacities typical of COVID-19. Read more in the AJR article: <a href=")
https://www.ajronline.org/doi/full/10.2214/AJR.20.23617
" loading="lazy" typeof="foaf:Image" class="img-responsive">
Read more
">
 at the early stage of the pneumonia. <em>B</em>, CT scans in different axial planes and coronal reconstruction show bilateral multifocal ground-glass opacities. The nodular opacity resolved. <a href=")
Read more
" loading="lazy" typeof="foaf:Image" class="img-responsive">
Read more
">

Read more
" loading="lazy" typeof="foaf:Image" class="img-responsive">
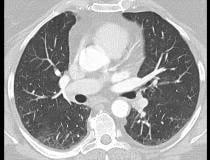
COVID-19 (SARS-CoV-2) positive patient's lung
computed tomography (CT) scan. It shows the typical white, ground glass opacities (GGO) caused by COVID pneumonia. The pneumonia typically appears along the walls of each lobe of the lung, especially the chest wall and the lower portions of the lungs. This scan is from a Canon Aquilion Prime SP CT scanner and used Advanced intelligent Clear-IQ Engine (AiCE), an artificial intelligence-driven image reconstruction software to improve image quality of lower-dose scans.
See a COVID lung CT scroll through video from this system.
">

COVID-19 (SARS-CoV-2) positive patient's lung
computed tomography (CT) scan. It shows the typical white, ground glass opacities (GGO) caused by COVID pneumonia. The pneumonia typically appears along the walls of each lobe of the lung, especially the chest wall and the lower portions of the lungs. This scan is from a Canon Aquilion Prime SP CT scanner and used Advanced intelligent Clear-IQ Engine (AiCE), an artificial intelligence-driven image reconstruction software to improve image quality of lower-dose scans.
See a COVID lung CT scroll through video from this system.
" loading="lazy" typeof="foaf:Image" class="img-responsive">
Read more.
">
 represents an important, although uncommon, differential consideration in patients with neurologic manifestations of coronavirus. Axial FLAIR MR image shows T2 prolongation in bilateral middle cerebellar peduncles (arrows). Findings were associated with restricted diffusion and areas of T1 hypointense signal without enhancement or abnormal susceptibility. Image courtesy of American Roentgen Ray Society (ARRS), American Journal of Roentgenology (AJR). <a href=")
Read more.
" loading="lazy" typeof="foaf:Image" class="img-responsive">
 infected tissue spread across the lungs. Image courtesy of Nature Publishing or npj Digital Medicine</p>") Read more
Read more. Image courtesy of RSNA.
">
 CT, (B) Xenon-129 MRI imaging of ventilation and (C) RBC phase imaging. (D) Xe-129 MRI gas and (E) RBC phase imaging for a healthy control. Xe-129 MRI images shown in the coronal view for both, with disrupted RBC in the patient due to micro-emboli the the capillaries in the lungs. <a href=")
Read more. Image courtesy of RSNA.
" loading="lazy" typeof="foaf:Image" class="img-responsive">
 2021 meeting. The software separates are areas of diseased tissue based on the density determined from the CT Hounsfield units.</p>") VIDEO: COVID Pneumonia Lung Consolidation on Ultrasound
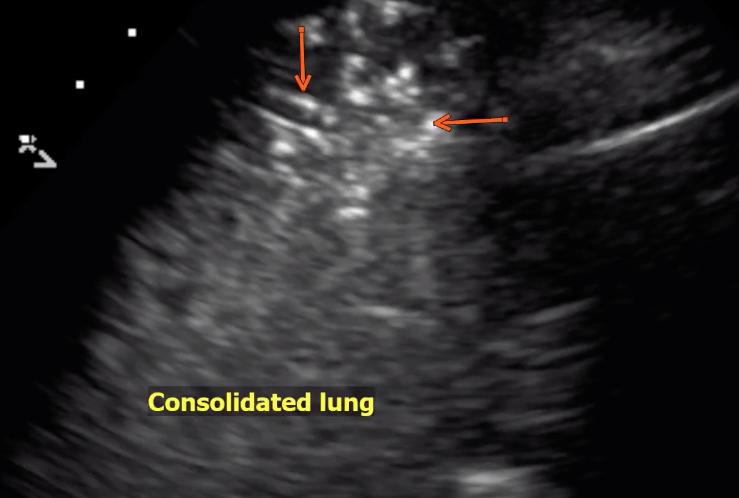
VIDEO: COVID Pneumonia Lung Consolidation on Ultrasound.
">
视频中查看移动的图像:超声上的COVID肺炎肺巩固。" title="
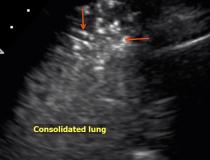
An example of COVID-19 (SARS-CoV-2) pneumonia lung consolidation on ultrasound. See this image moving in the VIDEO: COVID Pneumonia Lung Consolidation on Ultrasound.
" loading="lazy" typeof="foaf:Image" class="img-responsive">
 in healthy heart tissue (left) and in severe Covid-19 (right). Due to faulty reforming of the network as a result of Covid-19, numerous branches, splits and even loops develop in the capillaries, which can be analyzed mathematically. Image courtesy of M. Reichardt, P. Møller Jensen, T. Salditt</p>")
.</p>")


.</p>")

 show myocardial abnormalities in adults recovering from moderate and severe COVID-19. Note: this image is for illustrative purposes only and is not associated with the Big Ten study group. Image courtesy of Radiology.</p>")


, isolated from a patient sample. NIAID</p>")

 and control patients (B). C: The pattern expression score (PES; *adjusted for age and sex, for illustration purposes) of the previously established COVID-19-related spatial covariance pattern was not significantly different between patients with long-COVID syndrome and control patients. Boxplots (grey), as well as individual values </p>")


, increased axillary lymph node or ipsilateral deltoid uptake is occasionally observed on FDG or 11C-choline PET performed after Pfizer-BioNTech or Moderna COVID-19 vaccination</p>")
 infected tissue spread across the lungs. Image courtesy of Nature Publishing or npj Digital Medicine</p>")
 X-ray with PA view of a patient with COVID-19; (b) X-ray with AP view of a patient with COVID-19; (c) X-ray of a healthy patient from Dataset A; (d) X-ray of a healthy patient from Dataset B. Images courtesy of IEEE/CAA JOURNAL OF AUTOMATICA SINICA</p>") COVID-19 pneumonia
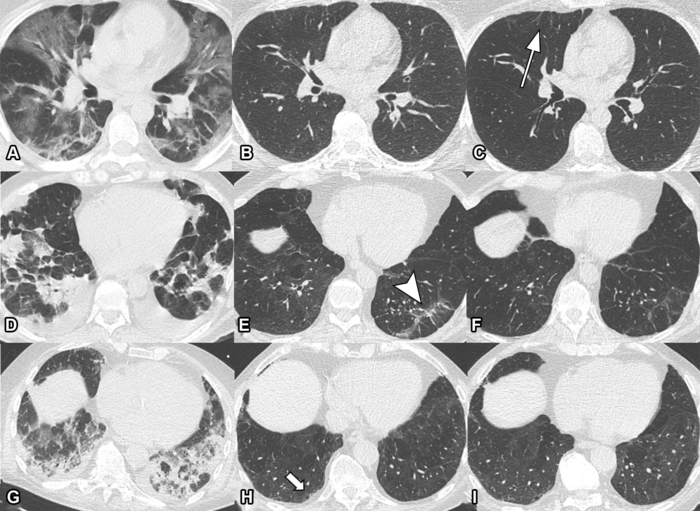
COVID-19 pneumonia. Chest CT of a 44-year-old man (upper row, A-C) displayed extensive bilateral GGO and supleural reticulation during acute COVID-19 (A). At the 2-month follow-up almost complete resolution of GGO with residual subpleural reticulation in the middle lobe was noted (B). These subpleural reticulations (arrow) persisted up to one year after onset (C). Chest CT of a 68-year-old-man (middle row, D-F) demonstrated patchy bilateral consolidations, a subpleural arcade-like sign and pleural effusions during active infection (D). At the 2-month follow-up, a substantial improvement of OP pattern was noted with GGO and subpleural reticulation including arcade-like sign (arrowhead) in the left lower lobe (E). At the 1-year follow-up, further improvement was noticed. However, subtle reticulation and GGO could still be detected (F). Chest CT of a 79-year-old man (lower row, G-I) displayed bilateral consolidations and small areas of GGO while admitted to the ICU (G). At the 2-month follow-up, residual GGO and small subpleural microcystic changes (thick arrow) were noticed (H), which persisted up to 1 year after onset (I). Image courtesy of the
Radiological Society of North America
">

COVID-19 pneumonia. Chest CT of a 44-year-old man (upper row, A-C) displayed extensive bilateral GGO and supleural reticulation during acute COVID-19 (A). At the 2-month follow-up almost complete resolution of GGO with residual subpleural reticulation in the middle lobe was noted (B). These subpleural reticulations (arrow) persisted up to one year after onset (C). Chest CT of a 68-year-old-man (middle row, D-F) demonstrated patchy bilateral consolidations, a subpleural arcade-like sign and pleural effusions during active infection (D). At the 2-month follow-up, a substantial improvement of OP pattern was noted with GGO and subpleural reticulation including arcade-like sign (arrowhead) in the left lower lobe (E). At the 1-year follow-up, further improvement was noticed. However, subtle reticulation and GGO could still be detected (F). Chest CT of a 79-year-old man (lower row, G-I) displayed bilateral consolidations and small areas of GGO while admitted to the ICU (G). At the 2-month follow-up, residual GGO and small subpleural microcystic changes (thick arrow) were noticed (H), which persisted up to 1 year after onset (I). Image courtesy of the
Radiological Society of North America
" loading="lazy" typeof="foaf:Image" class="img-responsive">

 and statistical parametric mapping analysis of metabolic group differences (second to fifth rows) in patients with COVID-19–related encephalopathy, patients with post-COVID-19 syndrome, and patients with post-COVID-19 syndrome and hyposmia compared to healthy controls (n=13). Image Created by PT Meyer, S Hellwig, G Blazhenets and JA Hosp, Medical Center – University of Freiburg, Germany.")


 issued a statement on Jan. 14 regarding the possible effect of Omicron infection on FDG PET/CT scans.")

. This enables 3D mapping across a range of scales, allowing clinicians to view the whole organ as never before by imaging it as a whole and then zooming down to cellular level. The technique uses X-rays supplied by the European Synchrotron in Grenoble, France.")
 compared with precontrast SSFP sequence (not shown) is observed on early post-contrast short-axis SSFP images in (A) 16-year-old male, (B) 17-year-old male, (C) 16-year-old male, and (D) 19-year-old male, and on early postcontrast short-axis perfusion image in (E) 17-year-old male (arrow, A-E). Late gadolinium enhancement (LGE) is also present (arrows) in all 5 patients (F, G,")
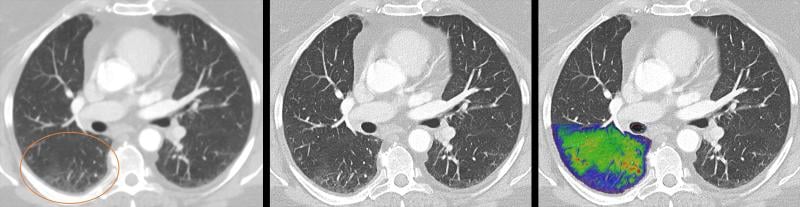 阅读更多" title="Lung images of a post-COVID patient with a Siemens Naeotom Alpha photon-counting CT system. The photon-counting technology allows simultaneous acquisition and visualization of detailed structures (center image) combined with functional information (right image). For comparison is an image with conventional CT (left). Courtesy of Dr. J. Ferda, University Hospital Plzen, Czech Republic.
 , and the gas uptake phase where there are numerous areas where there is gas present but it cannot be transferred to the blood due to micro-emboli (seen in the right RBC images). <a href=") Read more. Image courtesy of RSNA. " loading="lazy" typeof="foaf:Image" class="img-responsive">
Read more. Image courtesy of RSNA. " loading="lazy" typeof="foaf:Image" class="img-responsive">

 视频中查看此动态图像:超声上的COVID肺炎肺实变。" title="An example of COVID-19 (SARS-CoV-2) pneumonia lung consolidation on ultrasound and related B-lines in the image. See this image in motion in the
 . Researchers at Johns Hopkins Medicine showed in a May 2021 Journal of the American Society of Echocardiography study that speckle-tracking strain echocardiograms may predict which patients with COVID-19 are most at risk of developing atrial fibrillation (AF). <a href=") Read the study." loading="lazy" typeof="foaf:Image" class="img-responsive">
Read the study." loading="lazy" typeof="foaf:Image" class="img-responsive">
. Coronavirus often caused thrombus formation in the body, leading to numerous types of complications, including pulmonary embolism, stroke, heart attack, deep vein thrombosis (DVT) and ischemia or infarcts in various organs. Watch this image in motion in the VIDEO: Example of COVID Thrombosis on Ultrasound Imaging. Image courtesy of Margarita Revzin et al.")
 at the COVID vaccine injection site on 18-FDG PET/CT. <a href=") Read more in the original study. Image courtesy of RSNA." loading="lazy" typeof="foaf:Image" class="img-responsive">
Read more in the original study. Image courtesy of RSNA." loading="lazy" typeof="foaf:Image" class="img-responsive">
 that have burst out of kidney cells (green), which the virus hijacked for replication. The the bulging, spherical cells in the upper right and bottom left corners are distorted and about to burst from the viral particles inside, and are beginning to self-destruct. Image from NIAID Integrated Research Facility. Read more in the article <a href=") Deconstructing the Infectious Machinery of SARS-CoV-2.
Deconstructing the Infectious Machinery of SARS-CoV-2. in right upper lobe. B, Electron density spectral CT image obtained at same time as image in A shows lesions (within red box) in right upper lobe. C, Follow-up conventional axial chest CT image obtained 5 days after images in A and B confirm presence of lesions (within red box) in right upper lobe. <a href=") Read more. Image courtesy of the American Roentgen Ray Society (ARRS), American Journal of Roentgenology (AJR)" loading="lazy" typeof="foaf:Image" class="img-responsive">
Read more. Image courtesy of the American Roentgen Ray Society (ARRS), American Journal of Roentgenology (AJR)" loading="lazy" typeof="foaf:Image" class="img-responsive">

 Read more in the original study. Image courtesy of RSNA." loading="lazy" typeof="foaf:Image" class="img-responsive">
 in 16-year-old male (A) and 17-year-old male (B). Quantitative criteria included T2 parametric mapping and quantification of myocardial signal intensity ratios. Focal subepicardial edema of the basilar left ventricular inferior wall (arrow) is shown on source image from T2")
 Read more in the original study. Image courtesy of RSNA." loading="lazy" typeof="foaf:Image" class="img-responsive">
 Read more from this February 2021 study." loading="lazy" typeof="foaf:Image" class="img-responsive">
 after second COVID-19 mRNA vaccination dose. The uptake in the lymph node is typical of vaccinated patients, with the adenopathy occuring on the side with the arm that was vaccinated. <a href=") Read more in the original study. Image courtesy of RSNA.
Read more in the original study. Image courtesy of RSNA. after second COVID-19 mRNA vaccination dose. The uptake in the lymph node is typical of vaccinated patients, with the adenopathy occuring on the side with the arm that was vaccinated. <a href=") Read more in the original study. Image courtesy of RSNA." loading="lazy" typeof="foaf:Image" class="img-responsive">
Read more in the original study. Image courtesy of RSNA." loading="lazy" typeof="foaf:Image" class="img-responsive">
. BI-RADS category 0 was assigned. Ultrasound from diagnostic work-up performed 7 days later showed no change in lymph node size. BI-RADS 3 was assigned. <a href=") Read more from this February 2021 study." loading="lazy" typeof="foaf:Image" class="img-responsive">
Read more from this February 2021 study." loading="lazy" typeof="foaf:Image" class="img-responsive">
 and peribronchovascular (arrow) thickening, and diffuse ground-glass opacities. Pulmonary edema superimposed on the typical COVID-19 pneumonia. <a href=") Rezvin et al. Radiogrophics " loading="lazy" typeof="foaf:Image" class="img-responsive">
Rezvin et al. Radiogrophics " loading="lazy" typeof="foaf:Image" class="img-responsive">
 Read more. Image courtesy of European Heart Journal" loading="lazy" typeof="foaf:Image" class="img-responsive">
 infected with COVID-19 (SARS-CoV-2) (green). <a href=") Read more. Image by Lina Greenberg.
Read more. Image by Lina Greenberg. Margarita Rezvin et al.
  is a major cause of complications. <a href=") Read more on the trials. Image courtesy of
Read more on the trials. Image courtesy of  Margarita Revzin et al. " loading="lazy" typeof="foaf:Image" class="img-responsive">
. <a href=") Find more information and figures on this patient case." loading="lazy" typeof="foaf:Image" class="img-responsive">
Find more information and figures on this patient case." loading="lazy" typeof="foaf:Image" class="img-responsive">
 Read more. Image from Circulation." loading="lazy" typeof="foaf:Image" class="img-responsive">
 chest X-ray of a COVID-19 patient from Texas, showing COVID pneumonia along the sides of the chest walls. Photo from radiologist John Kim, M.D.</p>")

 Coronal left upper extremity CT angiographic image shows an abrupt segmental occlusion (arrow) of the distal left brachial artery, indicative of peripheral arterial thromboembolization. Coronal three-dimensional maximum intensity projection shows abrupt cutoff (arrow) of the left brachial artery. Image courtesy of <a href=") Margarita Revzin et al. " loading="lazy" typeof="foaf:Image" class="img-responsive">
Margarita Revzin et al. " loading="lazy" typeof="foaf:Image" class="img-responsive">
 Margarita Revzin et al. " loading="lazy" typeof="foaf:Image" class="img-responsive">
. COVID causes clot formation throughout the body in some patients, leading to organ infarcts like this, stroke and PE. Image courtesy of <a href=") Margarita Revzin et al. " loading="lazy" typeof="foaf:Image" class="img-responsive">
Margarita Revzin et al. " loading="lazy" typeof="foaf:Image" class="img-responsive">
. Air is depicted anterior to the pulmonary artery (white arrow) and adjacent to the main pulmonary artery and left atrial appendage, indicative of pneumomediastinum. Image courtesy of <a href=") Margarita Revzin et al. " loading="lazy" typeof="foaf:Image" class="img-responsive">
Margarita Revzin et al. " loading="lazy" typeof="foaf:Image" class="img-responsive">
 occlusion in a 56-year-old woman with neurologic deficits who had been hospitalized with COVID-19. Coronal three-dimensional maximum intensity projection reformatted image of the head and neck show an abrupt cutoff at the origin of the CCA (black arrow). The left carotid vasculature is well opacified with intravenous contrast material (white arrow). Image courtesy of <a href=") Margarita Revzin et al. " loading="lazy" typeof="foaf:Image" class="img-responsive">
Margarita Revzin et al. " loading="lazy" typeof="foaf:Image" class="img-responsive">
 and peripheral deep vein thrombosis (DVT) in a 78-year-old man with COVID-19 with leg swelling and abdominal pain. Axial contrast-enhanced CT images show filling defects in the bilateral common femoral veins (white arrows). Image courtesy of <a href=") Margarita Revzin et al. " loading="lazy" typeof="foaf:Image" class="img-responsive">
Margarita Revzin et al. " loading="lazy" typeof="foaf:Image" class="img-responsive">
 vertical echogenic bands (white arrows) extending from the pleural surface to the deeper portions of the lung, consistent with B-line artifacts, indicating subpleural interstitial edema. Note that the lung pleura is thickened and irregular (black arrow). Image courtesy of <a href=") Margarita Revzin et al. " loading="lazy" typeof="foaf:Image" class="img-responsive">
Margarita Revzin et al. " loading="lazy" typeof="foaf:Image" class="img-responsive">
 shown by the arrows. Image courtesy of <a href=") Margarita Revzin et al. " loading="lazy" typeof="foaf:Image" class="img-responsive">
Margarita Revzin et al. " loading="lazy" typeof="foaf:Image" class="img-responsive">
 distending the right popliteal artery. The characteristic knocking or “stump-thump” waveform with absence of diastolic flow and low amplitude imply the presence of occlusion just distal to the area of interrogation. Image courtesy of <a href=") Margarita Revzin et al. " loading="lazy" typeof="foaf:Image" class="img-responsive">
Margarita Revzin et al. " loading="lazy" typeof="foaf:Image" class="img-responsive">
 associated with a peripherally inserted central catheter (PICC) line in a 54-year-old man with COVID-19. Sagittal color Doppler ultrasound image shows an echogenic thrombus (black arrows) in the right subclavian vein, associated with the PICC line (white arrow). Image courtesy of <a href=") Margarita Revzin et al. " loading="lazy" typeof="foaf:Image" class="img-responsive">
Margarita Revzin et al. " loading="lazy" typeof="foaf:Image" class="img-responsive">
 heavily infected with SARS-CoV-2 virus particles (orange), isolated from a patient sample. Image captured at the National Institute of Allergy and Infectious Diseases (NIAID) Integrated Research Facility (IRF) in Fort Detrick, Maryland. Photo courtesy of NIAID</p>")
 Radiology article. Brain MRI in two critically ill COVID-19 patients with persistently depressed mental status including a 56-year old man (A-C), and a 64-year old man (D-F). Axial diffusion-weighted (A, D), apparent diffusion coefficient (B, E) and FLAIR (C, F) images at the level of centrum semiovale in both patients demonstrate symmetric diffuse T2/FLAIR hyperintensity (arrowheads) and mild restricted diffusion (thick arrows) involving the deep and subcortical white matter with relative sparing of juxtacortical white matter (thin arrows) in both patients. The restricted diffusion is more conspicuous than the T2/FLAIR hyperintensity." loading="lazy" typeof="foaf:Image" class="img-responsive">
 Radiology article: Axial T2-weighted (a) and FLAIR (b) Magnetic resonance imaging show diffuse hyperintense signal and edema of the caudate nucleus head, putamen, anterior limb of the internal capsule, and parts of external capsule and insula on the left side, with corresponding low values on the axial apparent diffusion coefficient map, in keeping with an acute infarct. Time-of-flight magnetic resonance angiography maximal intensity projection reformatted image demonstrates focal irregular narrowing and banding of the proximal left M1 segment of the middle cerebral artery with a slightly reduced distal flow in the middle cerebral artery." loading="lazy" typeof="foaf:Image" class="img-responsive">
, and a 64-year old man (D-F). Axial diffusion-weighted (A, D), apparent diffusion coefficient (B, E), and FLAIR (C, F) images at the level of centrum semiovale in both patients demonstrate symmetric diffuse T2/FLAIR hyperintensity (arrowheads) and mild restricted diffusion (thick arrows) involving the deep and subcortical white matter with relative sparing of juxtacortical white matter (thin arrows) in both patients. The restricted diffusion is more conspicuous than the T2/FLAIR hyperintensity. Courtesy of the RSNA journal Radiology.</p>")
 image of two coronaviruses (COVID-19) from high-powered microscopy.</p>")
 image of two coronaviruses (COVID-19) from high-powered microscopy.</p>")
 image of coronavirus (COVID-19) attached to a host cell.</p>")
. This severe autoimmune response that occurs a couple weeks after exposure to the SARS-CoV-2 virus. While COVID is largely asymptomatic in pediatric patients, MIS-C is a rare and severe reaction to the virus, which has occurred in more than 1,000 U.S. children as of late October 2020, including several fatalities. Read the article <a href=") Cardiac MRI Aids Evaluation of Children With Multisystem Inflammatory Syndrome (MIS-C) Associated With COVID-19" loading="lazy" typeof="foaf:Image" class="img-responsive">
Cardiac MRI Aids Evaluation of Children With Multisystem Inflammatory Syndrome (MIS-C) Associated With COVID-19" loading="lazy" typeof="foaf:Image" class="img-responsive">
 Read more about this COVID complication and find more information on these images." loading="lazy" typeof="foaf:Image" class="img-responsive">
 Read more. Image courtesy of Umberto Sabatini" loading="lazy" typeof="foaf:Image" class="img-responsive">
 of the left brachial plexus in the neck. The patient experienced left arm weakness and pain after recovering from COVID-19 respiratory illness, which prompted them to see their primary care physician. As a result of the MRI findings, the patient was referred to the COVID-19 neurology clinic for treatment. <a href=") Read more about this case. Image courtesy of Northwestern University" loading="lazy" typeof="foaf:Image" class="img-responsive">
Read more about this case. Image courtesy of Northwestern University" loading="lazy" typeof="foaf:Image" class="img-responsive">
 complicated by bowel ischemia and perforation in a 54-year-old man who presented to the emergency department with abdominal pain and was diagnosed with COVID-19. Contrast-enhanced CT images of the abdomen and pelvis show mucosal hyperenhancement involving the small bowel. <a href=") Scroll through this dataset. Image courtesy of
Scroll through this dataset. Image courtesy of  Scroll through this dataset. Image courtesy of
 . <a href=") Scroll through this dataset. Image courtesy of
Scroll through this dataset. Image courtesy of  in right upper lobe. B, Electron density spectral CT image obtained at same time as image in A shows lesions (within red box) in right upper lobe. C, Follow-up conventional axial chest CT image obtained 5 days after images in A and B confirm presence of lesions (within red box) in right upper lobe. <a href=") Read more. Image courtesy of the American Roentgen Ray Society (ARRS), American Journal of Roentgenology (AJR)
Read more. Image courtesy of the American Roentgen Ray Society (ARRS), American Journal of Roentgenology (AJR) showing COVID-19 pneumonia in the lungs with ground glass opacifies (GGOs) seen in typical COVID locations, clinging along the lower sections of the lung walls. <a href=") See the entire CT dataset scroll through video. Image courtesy of
See the entire CT dataset scroll through video. Image courtesy of  algorithms to automatically detect and score the severity of COVID-19 pneumonia in the lungs from CT or DR imaging. This chest X-ray shows the CAD4COVID AI software developed by <a href=") Thirona and
Thirona and  used a new revolutionary imaging technology called Hierarchical Phase-Contrast Tomography (HiP-CT), to scan donated human organs, including lungs from a Covid-19 donor.")
. Bilateral common iliac artery and left internal iliac artery thrombi (not shown) were also seen, as well as signs of chronic atherosclerotic disease. After findings of concurrently performed chest CT raised concerns, patient was determined to have COVID-19. Read more in the <em>AJR</em> article: <strong><a href=") https://www.ajronline.org/doi/full/10.2214/AJR.20.23617" loading="lazy" typeof="foaf:Image" class="img-responsive">
https://www.ajronline.org/doi/full/10.2214/AJR.20.23617" loading="lazy" typeof="foaf:Image" class="img-responsive">
 and nonocclusive aortic, celiac artery, and superior mesenteric artery thrombus (circle). Complete common hepatic artery thrombus (not shown) was also seen. Splenic and renal infarctions (not shown) were present, despite patent visualized associated arteries and veins. Concurrently performed IV contrast-enhanced chest CT angiogram (not shown) showed lobar and segmental pulmonary emboli; probable left lower lobe pulmonary infarction rather than pneumonia; and bilateral, multilobar, patchy but confluent ground-glass opacities typical of COVID-19. Read more in the AJR article: <a href=") https://www.ajronline.org/doi/full/10.2214/AJR.20.23617" loading="lazy" typeof="foaf:Image" class="img-responsive">
https://www.ajronline.org/doi/full/10.2214/AJR.20.23617" loading="lazy" typeof="foaf:Image" class="img-responsive">
 at the early stage of the pneumonia. <em>B</em>, CT scans in different axial planes and coronal reconstruction show bilateral multifocal ground-glass opacities. The nodular opacity resolved. <a href=") Read more " loading="lazy" typeof="foaf:Image" class="img-responsive">
Read more " loading="lazy" typeof="foaf:Image" class="img-responsive">
 Read more" loading="lazy" typeof="foaf:Image" class="img-responsive">
 COVID-19 (SARS-CoV-2) positive patient's lung
  represents an important, although uncommon, differential consideration in patients with neurologic manifestations of coronavirus. Axial FLAIR MR image shows T2 prolongation in bilateral middle cerebellar peduncles (arrows). Findings were associated with restricted diffusion and areas of T1 hypointense signal without enhancement or abnormal susceptibility. Image courtesy of American Roentgen Ray Society (ARRS), American Journal of Roentgenology (AJR). <a href=") Read more." loading="lazy" typeof="foaf:Image" class="img-responsive">
Read more." loading="lazy" typeof="foaf:Image" class="img-responsive">
 infected tissue spread across the lungs. Image courtesy of Nature Publishing or npj Digital Medicine</p>")
 CT, (B) Xenon-129 MRI imaging of ventilation and (C) RBC phase imaging. (D) Xe-129 MRI gas and (E) RBC phase imaging for a healthy control. Xe-129 MRI images shown in the coronal view for both, with disrupted RBC in the patient due to micro-emboli the the capillaries in the lungs. <a href=") Read more. Image courtesy of RSNA." loading="lazy" typeof="foaf:Image" class="img-responsive">
Read more. Image courtesy of RSNA." loading="lazy" typeof="foaf:Image" class="img-responsive">
 2021 meeting. The software separates are areas of diseased tissue based on the density determined from the CT Hounsfield units.")
 视频中查看移动的图像:超声上的COVID肺炎肺巩固。" title="An example of COVID-19 (SARS-CoV-2) pneumonia lung consolidation on ultrasound. See this image moving in the
  in healthy heart tissue (left) and in severe Covid-19 (right). Due to faulty reforming of the network as a result of Covid-19, numerous branches, splits and even loops develop in the capillaries, which can be analyzed mathematically. Image courtesy of M. Reichardt, P. Møller Jensen, T. Salditt")
.")


.")

 show myocardial abnormalities in adults recovering from moderate and severe COVID-19. Note: this image is for illustrative purposes only and is not associated with the Big Ten study group. Image courtesy of Radiology.")


, isolated from a patient sample. NIAID")

 and control patients (B). C: The pattern expression score (PES; *adjusted for age and sex, for illustration purposes) of the previously established COVID-19-related spatial covariance pattern was not significantly different between patients with long-COVID syndrome and control patients. Boxplots (grey), as well as individual values")


, increased axillary lymph node or ipsilateral deltoid uptake is occasionally observed on FDG or 11C-choline PET performed after Pfizer-BioNTech or Moderna COVID-19 vaccination")
 infected tissue spread across the lungs. Image courtesy of Nature Publishing or npj Digital Medicine")
 X-ray with PA view of a patient with COVID-19; (b) X-ray with AP view of a patient with COVID-19; (c) X-ray of a healthy patient from Dataset A; (d) X-ray of a healthy patient from Dataset B. Images courtesy of IEEE/CAA JOURNAL OF AUTOMATICA SINICA")
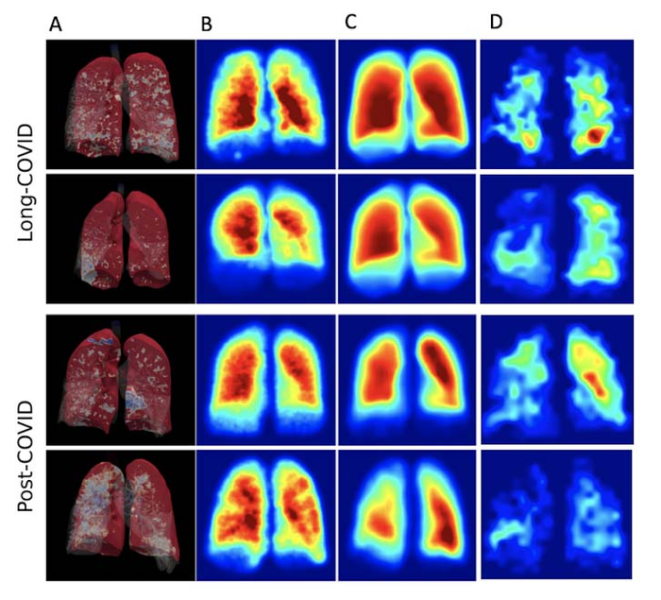
 According to ARRS’ American Journal of Roentgenology (AJR), evaluating chest CT findings offers an additional approach for demonstrating the efficacy of different COVID-19 vaccines in reducing the impact of a COVID-19 diagnosis.
  (A), FAN modelling (B), and hyperpolarized Xenon imaging (C, D) in both non-hospitalized post-Covid-19 condition and post-hospitalized COVID-19 participants. Results from both the low-resolution and ventilation imaging are similar and did not correlate with clinical or dissolved phase imaging results. Image courtesy of the <a href=") Radiological Society of North America
Radiological Society of North America
, and proton and RBC:TP imaging from post-hospitalized <a href=") COVID patients. There is minimal damage on cT, and yet highly heterogeneous and low RBC:TP in the lungs of post-hospitalized COVID-19 patients. Image courtesy of Grist JT et al., published online in
COVID patients. There is minimal damage on cT, and yet highly heterogeneous and low RBC:TP in the lungs of post-hospitalized COVID-19 patients. Image courtesy of Grist JT et al., published online in  X-ray (CXRs) and CT images. (E and F) A 36-year-old male with no history of vaccination for
  Non-contrast axial and sagittal chest CTs corresponding to the CT severity score. (A) 1: minimal (subtle GGO, very few findings): CT shows subtle subpleural GGO (arrow) in the right and left lower lobe. (B) 2: low (several GGO, subtle reticulation): CT shows several subpleural GGO and superimposed reticulation (arrow) in the right and left lower lobe and left upper lobe. (C) 3: moderate (multiple GGO, reticulation, small consolidation): CT shows multiple GGO in all lobes. (D) 4: marked (extensive GGO, consolidation, reticulation with distortion): CT shows extensive subpleural GGO, and consolidations (arrow) in the dependent lung. (E) 5: massive (massive findings, parenchymal destructions*): CT shows massive consolidations in the dependent lung areas as well as extensive GGO in the upper lobes. *Parenchymal destruction includes pneumatocele, cavitation or abscess formation. GGO= ground-glass opacities. Image courtesy of the
  and statistical parametric mapping analysis of metabolic group differences (second to fifth rows) in patients with COVID-19–related encephalopathy, patients with post-COVID-19 syndrome, and patients with post-COVID-19 syndrome and hyposmia compared to healthy controls (n=13). Image Created by PT Meyer, S Hellwig, G Blazhenets and JA Hosp, Medical Center – University of Freiburg, Germany. <a href=") More information
" loading="lazy" typeof="foaf:Image" class="img-responsive">
More information
" loading="lazy" typeof="foaf:Image" class="img-responsive">


 issued a statement on Jan. 14 regarding the possible effect of Omicron infection on FDG PET/CT scans.</p>")

. This enables 3D mapping across a range of scales, allowing clinicians to view the whole organ as never before by imaging it as a whole and then zooming down to cellular level. The technique uses X-rays supplied by the European Synchrotron in Grenoble, France.</p>")
 compared with precontrast SSFP sequence (not shown) is observed on early post-contrast short-axis SSFP images in (A) 16-year-old male, (B) 17-year-old male, (C) 16-year-old male, and (D) 19-year-old male, and on early postcontrast short-axis perfusion image in (E) 17-year-old male (arrow, A-E). Late gadolinium enhancement (LGE) is also present (arrows) in all 5 patients (F, G, </p>")
 阅读更多" title="
, and the gas uptake phase where there are numerous areas where there is gas present but it cannot be transferred to the blood due to micro-emboli (seen in the right RBC images). <a href=") Read more. Image courtesy of RSNA.
" loading="lazy" typeof="foaf:Image" class="img-responsive">
Read more. Image courtesy of RSNA.
" loading="lazy" typeof="foaf:Image" class="img-responsive">

 视频中查看此动态图像:超声上的COVID肺炎肺实变。" title="
. Researchers at Johns Hopkins Medicine showed in a May 2021 Journal of the American Society of Echocardiography study that speckle-tracking strain echocardiograms may predict which patients with COVID-19 are most at risk of developing atrial fibrillation (AF). <a href=") Read the study.
" loading="lazy" typeof="foaf:Image" class="img-responsive">
Read the study.
" loading="lazy" typeof="foaf:Image" class="img-responsive">
. Coronavirus often caused thrombus formation in the body, leading to numerous types of complications, including pulmonary embolism, stroke, heart attack, deep vein thrombosis (DVT) and ischemia or infarcts in various organs. Watch this image in motion in the VIDEO: Example of COVID Thrombosis on Ultrasound Imaging. Image courtesy of Margarita Revzin et al. </p>")
 at the COVID vaccine injection site on 18-FDG PET/CT. <a href=") Read more in the original study. Image courtesy of RSNA.
" loading="lazy" typeof="foaf:Image" class="img-responsive">
Read more in the original study. Image courtesy of RSNA.
" loading="lazy" typeof="foaf:Image" class="img-responsive">
 that have burst out of kidney cells (green), which the virus hijacked for replication. The the bulging, spherical cells in the upper right and bottom left corners are distorted and about to burst from the viral particles inside, and are beginning to self-destruct. Image from NIAID Integrated Research Facility. Read more in the article <a href=") Deconstructing the Infectious Machinery of SARS-CoV-2.
Deconstructing the Infectious Machinery of SARS-CoV-2.
 in right upper lobe. B, Electron density spectral CT image obtained at same time as image in A shows lesions (within red box) in right upper lobe. C, Follow-up conventional axial chest CT image obtained 5 days after images in A and B confirm presence of lesions (within red box) in right upper lobe. <a href=") Read more. Image courtesy of the American Roentgen Ray Society (ARRS), American Journal of Roentgenology (AJR)
" loading="lazy" typeof="foaf:Image" class="img-responsive">
Read more. Image courtesy of the American Roentgen Ray Society (ARRS), American Journal of Roentgenology (AJR)
" loading="lazy" typeof="foaf:Image" class="img-responsive">

 Read more in the original study. Image courtesy of RSNA.
" loading="lazy" typeof="foaf:Image" class="img-responsive">
Read more in the original study. Image courtesy of RSNA.
" loading="lazy" typeof="foaf:Image" class="img-responsive">
 in 16-year-old male (A) and 17-year-old male (B). Quantitative criteria included T2 parametric mapping and quantification of myocardial signal intensity ratios. Focal subepicardial edema of the basilar left ventricular inferior wall (arrow) is shown on source image from T2</p>")
 Read more in the original study. Image courtesy of RSNA.
" loading="lazy" typeof="foaf:Image" class="img-responsive">
Read more in the original study. Image courtesy of RSNA.
" loading="lazy" typeof="foaf:Image" class="img-responsive">
 Read more from this February 2021 study.
" loading="lazy" typeof="foaf:Image" class="img-responsive">
Read more from this February 2021 study.
" loading="lazy" typeof="foaf:Image" class="img-responsive">
 after second COVID-19 mRNA vaccination dose. The uptake in the lymph node is typical of vaccinated patients, with the adenopathy occuring on the side with the arm that was vaccinated. <a href=") Read more in the original study. Image courtesy of RSNA.
Read more in the original study. Image courtesy of RSNA. after second COVID-19 mRNA vaccination dose. The uptake in the lymph node is typical of vaccinated patients, with the adenopathy occuring on the side with the arm that was vaccinated. <a href=") Read more in the original study. Image courtesy of RSNA.
" loading="lazy" typeof="foaf:Image" class="img-responsive">
Read more in the original study. Image courtesy of RSNA.
" loading="lazy" typeof="foaf:Image" class="img-responsive">
. BI-RADS category 0 was assigned. Ultrasound from diagnostic work-up performed 7 days later showed no change in lymph node size. BI-RADS 3 was assigned. <a href=") Read more from this February 2021 study.
" loading="lazy" typeof="foaf:Image" class="img-responsive">
Read more from this February 2021 study.
" loading="lazy" typeof="foaf:Image" class="img-responsive">
 and peribronchovascular (arrow) thickening, and diffuse ground-glass opacities. Pulmonary edema superimposed on the typical COVID-19 pneumonia. <a href=") Rezvin et al. Radiogrophics
" loading="lazy" typeof="foaf:Image" class="img-responsive">
Rezvin et al. Radiogrophics
" loading="lazy" typeof="foaf:Image" class="img-responsive">
 Read more. Image courtesy of European Heart Journal
" loading="lazy" typeof="foaf:Image" class="img-responsive">
Read more. Image courtesy of European Heart Journal
" loading="lazy" typeof="foaf:Image" class="img-responsive">
 infected with COVID-19 (SARS-CoV-2) (green). <a href=") Read more. Image by Lina Greenberg.
Read more. Image by Lina Greenberg. Margarita Rezvin et al.
  is a major cause of complications. <a href=") Read more on the trials. Image courtesy of
Read more on the trials. Image courtesy of  Margarita Revzin et al.
" loading="lazy" typeof="foaf:Image" class="img-responsive">
Margarita Revzin et al.
" loading="lazy" typeof="foaf:Image" class="img-responsive">
. <a href=") Find more information and figures on this patient case.
" loading="lazy" typeof="foaf:Image" class="img-responsive">
Find more information and figures on this patient case.
" loading="lazy" typeof="foaf:Image" class="img-responsive">
 Read more. Image from Circulation.
" loading="lazy" typeof="foaf:Image" class="img-responsive">
Read more. Image from Circulation.
" loading="lazy" typeof="foaf:Image" class="img-responsive">
 chest X-ray of a COVID-19 patient from Texas, showing COVID pneumonia along the sides of the chest walls. Photo from radiologist John Kim, M.D.</p>")

 Coronal left upper extremity CT angiographic image shows an abrupt segmental occlusion (arrow) of the distal left brachial artery, indicative of peripheral arterial thromboembolization. Coronal three-dimensional maximum intensity projection shows abrupt cutoff (arrow) of the left brachial artery. Image courtesy of <a href=") Margarita Revzin et al.
" loading="lazy" typeof="foaf:Image" class="img-responsive">
Margarita Revzin et al.
" loading="lazy" typeof="foaf:Image" class="img-responsive">
 Margarita Revzin et al.
" loading="lazy" typeof="foaf:Image" class="img-responsive">
Margarita Revzin et al.
" loading="lazy" typeof="foaf:Image" class="img-responsive">
. COVID causes clot formation throughout the body in some patients, leading to organ infarcts like this, stroke and PE. Image courtesy of <a href=") Margarita Revzin et al.
" loading="lazy" typeof="foaf:Image" class="img-responsive">
Margarita Revzin et al.
" loading="lazy" typeof="foaf:Image" class="img-responsive">
. Air is depicted anterior to the pulmonary artery (white arrow) and adjacent to the main pulmonary artery and left atrial appendage, indicative of pneumomediastinum. Image courtesy of <a href=") Margarita Revzin et al.
" loading="lazy" typeof="foaf:Image" class="img-responsive">
Margarita Revzin et al.
" loading="lazy" typeof="foaf:Image" class="img-responsive">
 occlusion in a 56-year-old woman with neurologic deficits who had been hospitalized with COVID-19. Coronal three-dimensional maximum intensity projection reformatted image of the head and neck show an abrupt cutoff at the origin of the CCA (black arrow). The left carotid vasculature is well opacified with intravenous contrast material (white arrow). Image courtesy of <a href=") Margarita Revzin et al.
" loading="lazy" typeof="foaf:Image" class="img-responsive">
Margarita Revzin et al.
" loading="lazy" typeof="foaf:Image" class="img-responsive">
 and peripheral deep vein thrombosis (DVT) in a 78-year-old man with COVID-19 with leg swelling and abdominal pain. Axial contrast-enhanced CT images show filling defects in the bilateral common femoral veins (white arrows). Image courtesy of <a href=") Margarita Revzin et al.
" loading="lazy" typeof="foaf:Image" class="img-responsive">
Margarita Revzin et al.
" loading="lazy" typeof="foaf:Image" class="img-responsive">
 vertical echogenic bands (white arrows) extending from the pleural surface to the deeper portions of the lung, consistent with B-line artifacts, indicating subpleural interstitial edema. Note that the lung pleura is thickened and irregular (black arrow). Image courtesy of <a href=") Margarita Revzin et al.
" loading="lazy" typeof="foaf:Image" class="img-responsive">
Margarita Revzin et al.
" loading="lazy" typeof="foaf:Image" class="img-responsive">
 shown by the arrows. Image courtesy of <a href=") Margarita Revzin et al.
" loading="lazy" typeof="foaf:Image" class="img-responsive">
Margarita Revzin et al.
" loading="lazy" typeof="foaf:Image" class="img-responsive">
 distending the right popliteal artery. The characteristic knocking or “stump-thump” waveform with absence of diastolic flow and low amplitude imply the presence of occlusion just distal to the area of interrogation. Image courtesy of <a href=") Margarita Revzin et al.
" loading="lazy" typeof="foaf:Image" class="img-responsive">
Margarita Revzin et al.
" loading="lazy" typeof="foaf:Image" class="img-responsive">
 associated with a peripherally inserted central catheter (PICC) line in a 54-year-old man with COVID-19. Sagittal color Doppler ultrasound image shows an echogenic thrombus (black arrows) in the right subclavian vein, associated with the PICC line (white arrow). Image courtesy of <a href=") Margarita Revzin et al.
" loading="lazy" typeof="foaf:Image" class="img-responsive">
Margarita Revzin et al.
" loading="lazy" typeof="foaf:Image" class="img-responsive">
 heavily infected with SARS-CoV-2 virus particles (orange), isolated from a patient sample. Image captured at the National Institute of Allergy and Infectious Diseases (NIAID) Integrated Research Facility (IRF) in Fort Detrick, Maryland. Photo courtesy of NIAID</p>")
 Radiology article. Brain MRI in two critically ill COVID-19 patients with persistently depressed mental status including a 56-year old man (A-C), and a 64-year old man (D-F). Axial diffusion-weighted (A, D), apparent diffusion coefficient (B, E) and FLAIR (C, F) images at the level of centrum semiovale in both patients demonstrate symmetric diffuse T2/FLAIR hyperintensity (arrowheads) and mild restricted diffusion (thick arrows) involving the deep and subcortical white matter with relative sparing of juxtacortical white matter (thin arrows) in both patients. The restricted diffusion is more conspicuous than the T2/FLAIR hyperintensity.
" loading="lazy" typeof="foaf:Image" class="img-responsive">
Radiology article. Brain MRI in two critically ill COVID-19 patients with persistently depressed mental status including a 56-year old man (A-C), and a 64-year old man (D-F). Axial diffusion-weighted (A, D), apparent diffusion coefficient (B, E) and FLAIR (C, F) images at the level of centrum semiovale in both patients demonstrate symmetric diffuse T2/FLAIR hyperintensity (arrowheads) and mild restricted diffusion (thick arrows) involving the deep and subcortical white matter with relative sparing of juxtacortical white matter (thin arrows) in both patients. The restricted diffusion is more conspicuous than the T2/FLAIR hyperintensity.
" loading="lazy" typeof="foaf:Image" class="img-responsive">
 Radiology article: Axial T2-weighted (a) and FLAIR (b) Magnetic resonance imaging show diffuse hyperintense signal and edema of the caudate nucleus head, putamen, anterior limb of the internal capsule, and parts of external capsule and insula on the left side, with corresponding low values on the axial apparent diffusion coefficient map, in keeping with an acute infarct. Time-of-flight magnetic resonance angiography maximal intensity projection reformatted image demonstrates focal irregular narrowing and banding of the proximal left M1 segment of the middle cerebral artery with a slightly reduced distal flow in the middle cerebral artery.
" loading="lazy" typeof="foaf:Image" class="img-responsive">
Radiology article: Axial T2-weighted (a) and FLAIR (b) Magnetic resonance imaging show diffuse hyperintense signal and edema of the caudate nucleus head, putamen, anterior limb of the internal capsule, and parts of external capsule and insula on the left side, with corresponding low values on the axial apparent diffusion coefficient map, in keeping with an acute infarct. Time-of-flight magnetic resonance angiography maximal intensity projection reformatted image demonstrates focal irregular narrowing and banding of the proximal left M1 segment of the middle cerebral artery with a slightly reduced distal flow in the middle cerebral artery.
" loading="lazy" typeof="foaf:Image" class="img-responsive">
, and a 64-year old man (D-F). Axial diffusion-weighted (A, D), apparent diffusion coefficient (B, E), and FLAIR (C, F) images at the level of centrum semiovale in both patients demonstrate symmetric diffuse T2/FLAIR hyperintensity (arrowheads) and mild restricted diffusion (thick arrows) involving the deep and subcortical white matter with relative sparing of juxtacortical white matter (thin arrows) in both patients. The restricted diffusion is more conspicuous than the T2/FLAIR hyperintensity. Courtesy of the RSNA journal Radiology.</p>")
 image of two coronaviruses (COVID-19) from high-powered microscopy.</p>")
 image of two coronaviruses (COVID-19) from high-powered microscopy.</p>")
 image of coronavirus (COVID-19) attached to a host cell.</p>")
. This severe autoimmune response that occurs a couple weeks after exposure to the SARS-CoV-2 virus. While COVID is largely asymptomatic in pediatric patients, MIS-C is a rare and severe reaction to the virus, which has occurred in more than 1,000 U.S. children as of late October 2020, including several fatalities. Read the article <a href=") Cardiac MRI Aids Evaluation of Children With Multisystem Inflammatory Syndrome (MIS-C) Associated With COVID-19
" loading="lazy" typeof="foaf:Image" class="img-responsive">
Cardiac MRI Aids Evaluation of Children With Multisystem Inflammatory Syndrome (MIS-C) Associated With COVID-19
" loading="lazy" typeof="foaf:Image" class="img-responsive">
 Read more about this COVID complication and find more information on these images.
" loading="lazy" typeof="foaf:Image" class="img-responsive">
Read more about this COVID complication and find more information on these images.
" loading="lazy" typeof="foaf:Image" class="img-responsive">
 Read more. Image courtesy of Umberto Sabatini
" loading="lazy" typeof="foaf:Image" class="img-responsive">
Read more. Image courtesy of Umberto Sabatini
" loading="lazy" typeof="foaf:Image" class="img-responsive">
 of the left brachial plexus in the neck. The patient experienced left arm weakness and pain after recovering from COVID-19 respiratory illness, which prompted them to see their primary care physician. As a result of the MRI findings, the patient was referred to the COVID-19 neurology clinic for treatment. <a href=") Read more about this case. Image courtesy of Northwestern University
" loading="lazy" typeof="foaf:Image" class="img-responsive">
Read more about this case. Image courtesy of Northwestern University
" loading="lazy" typeof="foaf:Image" class="img-responsive">
 complicated by bowel ischemia and perforation in a 54-year-old man who presented to the emergency department with abdominal pain and was diagnosed with COVID-19. Contrast-enhanced CT images of the abdomen and pelvis show mucosal hyperenhancement involving the small bowel. <a href=") Scroll through this dataset. Image courtesy of
Scroll through this dataset. Image courtesy of  Scroll through this dataset. Image courtesy of
 . <a href=") Scroll through this dataset. Image courtesy of
Scroll through this dataset. Image courtesy of  in right upper lobe. B, Electron density spectral CT image obtained at same time as image in A shows lesions (within red box) in right upper lobe. C, Follow-up conventional axial chest CT image obtained 5 days after images in A and B confirm presence of lesions (within red box) in right upper lobe. <a href=") Read more. Image courtesy of the American Roentgen Ray Society (ARRS), American Journal of Roentgenology (AJR)
Read more. Image courtesy of the American Roentgen Ray Society (ARRS), American Journal of Roentgenology (AJR) showing COVID-19 pneumonia in the lungs with ground glass opacifies (GGOs) seen in typical COVID locations, clinging along the lower sections of the lung walls. <a href=") See the entire CT dataset scroll through video. Image courtesy of
See the entire CT dataset scroll through video. Image courtesy of  algorithms to automatically detect and score the severity of COVID-19 pneumonia in the lungs from CT or DR imaging. This chest X-ray shows the CAD4COVID AI software developed by <a href=") Thirona and
Thirona and  used a new revolutionary imaging technology called Hierarchical Phase-Contrast Tomography (HiP-CT), to scan donated human organs, including lungs from a Covid-19 donor.</p>")
. Bilateral common iliac artery and left internal iliac artery thrombi (not shown) were also seen, as well as signs of chronic atherosclerotic disease. After findings of concurrently performed chest CT raised concerns, patient was determined to have COVID-19. Read more in the <em>AJR</em> article: <strong><a href=") https://www.ajronline.org/doi/full/10.2214/AJR.20.23617
" loading="lazy" typeof="foaf:Image" class="img-responsive">
https://www.ajronline.org/doi/full/10.2214/AJR.20.23617
" loading="lazy" typeof="foaf:Image" class="img-responsive">
 and nonocclusive aortic, celiac artery, and superior mesenteric artery thrombus (circle). Complete common hepatic artery thrombus (not shown) was also seen. Splenic and renal infarctions (not shown) were present, despite patent visualized associated arteries and veins. Concurrently performed IV contrast-enhanced chest CT angiogram (not shown) showed lobar and segmental pulmonary emboli; probable left lower lobe pulmonary infarction rather than pneumonia; and bilateral, multilobar, patchy but confluent ground-glass opacities typical of COVID-19. Read more in the AJR article: <a href=") https://www.ajronline.org/doi/full/10.2214/AJR.20.23617
" loading="lazy" typeof="foaf:Image" class="img-responsive">
https://www.ajronline.org/doi/full/10.2214/AJR.20.23617
" loading="lazy" typeof="foaf:Image" class="img-responsive">
 at the early stage of the pneumonia. <em>B</em>, CT scans in different axial planes and coronal reconstruction show bilateral multifocal ground-glass opacities. The nodular opacity resolved. <a href=") Read more
" loading="lazy" typeof="foaf:Image" class="img-responsive">
Read more
" loading="lazy" typeof="foaf:Image" class="img-responsive">
 Read more
" loading="lazy" typeof="foaf:Image" class="img-responsive">
Read more
" loading="lazy" typeof="foaf:Image" class="img-responsive">
 COVID-19 (SARS-CoV-2) positive patient's lung
  represents an important, although uncommon, differential consideration in patients with neurologic manifestations of coronavirus. Axial FLAIR MR image shows T2 prolongation in bilateral middle cerebellar peduncles (arrows). Findings were associated with restricted diffusion and areas of T1 hypointense signal without enhancement or abnormal susceptibility. Image courtesy of American Roentgen Ray Society (ARRS), American Journal of Roentgenology (AJR). <a href=") Read more.
" loading="lazy" typeof="foaf:Image" class="img-responsive">
Read more.
" loading="lazy" typeof="foaf:Image" class="img-responsive">
 infected tissue spread across the lungs. Image courtesy of Nature Publishing or npj Digital Medicine</p>")
 CT, (B) Xenon-129 MRI imaging of ventilation and (C) RBC phase imaging. (D) Xe-129 MRI gas and (E) RBC phase imaging for a healthy control. Xe-129 MRI images shown in the coronal view for both, with disrupted RBC in the patient due to micro-emboli the the capillaries in the lungs. <a href=") Read more. Image courtesy of RSNA.
" loading="lazy" typeof="foaf:Image" class="img-responsive">
Read more. Image courtesy of RSNA.
" loading="lazy" typeof="foaf:Image" class="img-responsive">
 2021 meeting. The software separates are areas of diseased tissue based on the density determined from the CT Hounsfield units.</p>")
 视频中查看移动的图像:超声上的COVID肺炎肺巩固。" title="
 in healthy heart tissue (left) and in severe Covid-19 (right). Due to faulty reforming of the network as a result of Covid-19, numerous branches, splits and even loops develop in the capillaries, which can be analyzed mathematically. Image courtesy of M. Reichardt, P. Møller Jensen, T. Salditt</p>")
.</p>")


.</p>")

 show myocardial abnormalities in adults recovering from moderate and severe COVID-19. Note: this image is for illustrative purposes only and is not associated with the Big Ten study group. Image courtesy of Radiology.</p>")


, isolated from a patient sample. NIAID</p>")

 and control patients (B). C: The pattern expression score (PES; *adjusted for age and sex, for illustration purposes) of the previously established COVID-19-related spatial covariance pattern was not significantly different between patients with long-COVID syndrome and control patients. Boxplots (grey), as well as individual values </p>")


, increased axillary lymph node or ipsilateral deltoid uptake is occasionally observed on FDG or 11C-choline PET performed after Pfizer-BioNTech or Moderna COVID-19 vaccination</p>")
 infected tissue spread across the lungs. Image courtesy of Nature Publishing or npj Digital Medicine</p>")
 X-ray with PA view of a patient with COVID-19; (b) X-ray with AP view of a patient with COVID-19; (c) X-ray of a healthy patient from Dataset A; (d) X-ray of a healthy patient from Dataset B. Images courtesy of IEEE/CAA JOURNAL OF AUTOMATICA SINICA</p>")
 COVID-19 pneumonia. Chest CT of a 44-year-old man (upper row, A-C) displayed extensive bilateral GGO and supleural reticulation during acute COVID-19 (A). At the 2-month follow-up almost complete resolution of GGO with residual subpleural reticulation in the middle lobe was noted (B). These subpleural reticulations (arrow) persisted up to one year after onset (C). Chest CT of a 68-year-old-man (middle row, D-F) demonstrated patchy bilateral consolidations, a subpleural arcade-like sign and pleural effusions during active infection (D). At the 2-month follow-up, a substantial improvement of OP pattern was noted with GGO and subpleural reticulation including arcade-like sign (arrowhead) in the left lower lobe (E). At the 1-year follow-up, further improvement was noticed. However, subtle reticulation and GGO could still be detected (F). Chest CT of a 79-year-old man (lower row, G-I) displayed bilateral consolidations and small areas of GGO while admitted to the ICU (G). At the 2-month follow-up, residual GGO and small subpleural microcystic changes (thick arrow) were noticed (H), which persisted up to 1 year after onset (I). Image courtesy of the